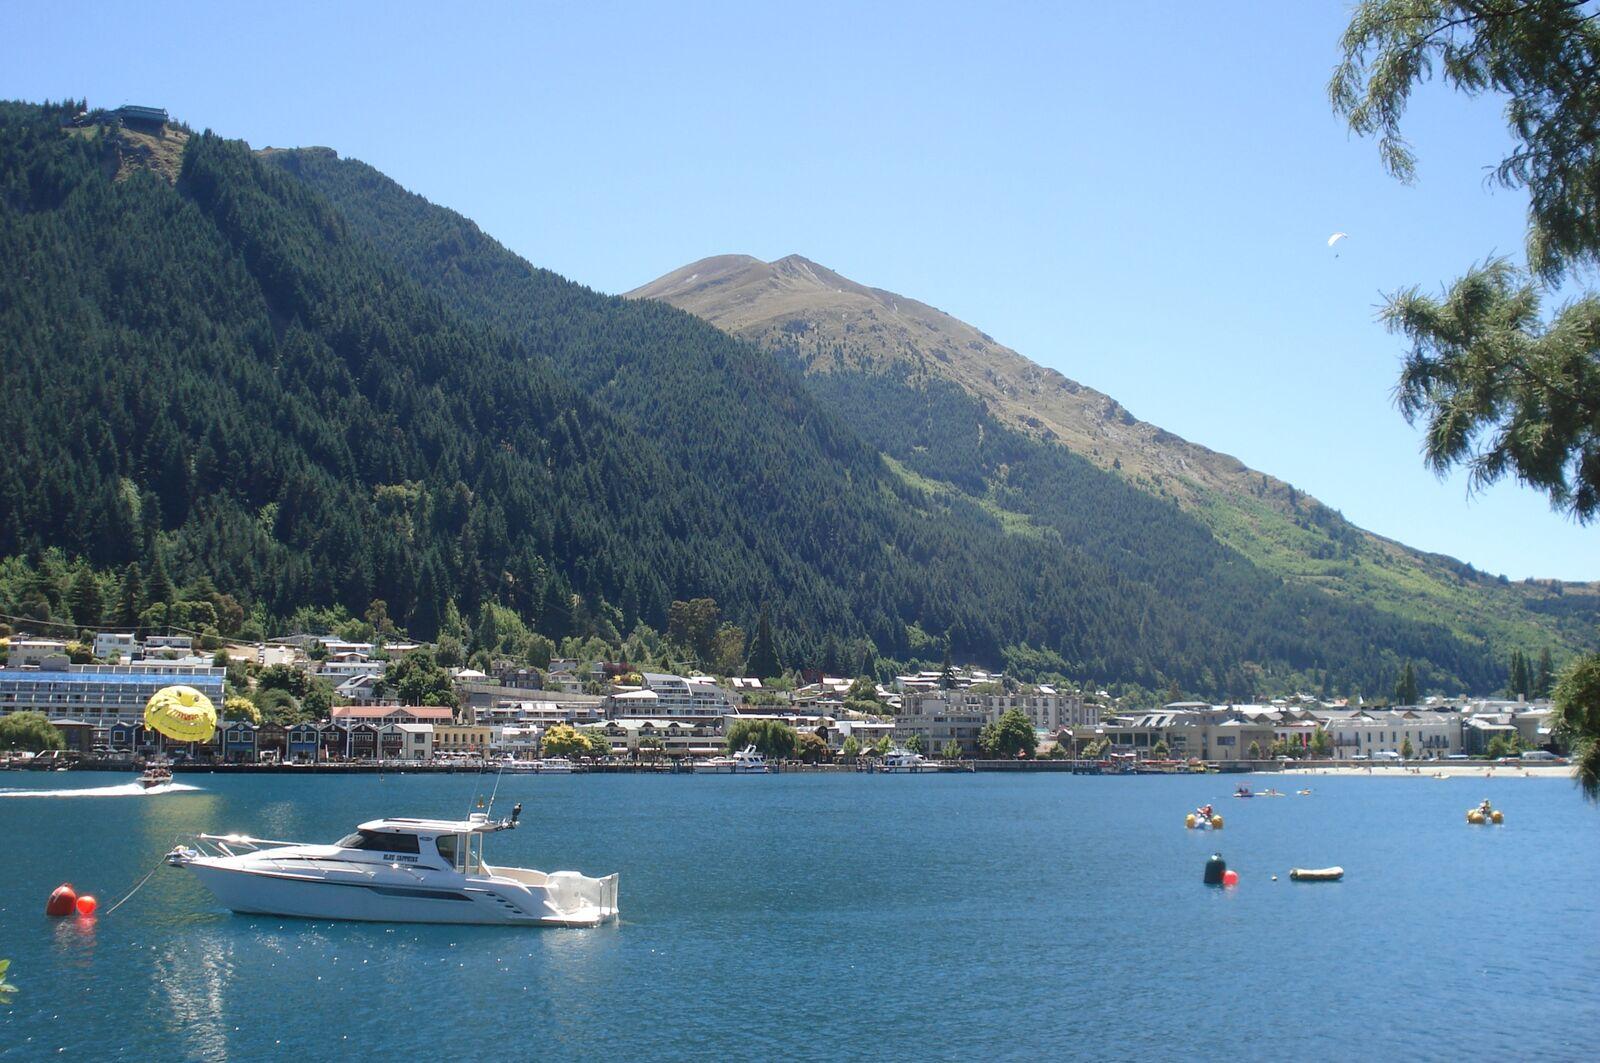
Photo: AwOiSoAk KaOsIoWa (opens in a new tab), CC BY-SA 3.0 (opens in a new tab)
Queenstown in January
Checked 4 Sept 2026Published 4 Sept 2026
In short
January is the warmest month (mean 15.9 C) and the sunniest (237 hours) on NIWA's normals, and it is also the peak: the Christmas to New Year fortnight runs into the first week with commercial accommodation at 89 percent or more. Book beds and the Milford day months ahead, walk early, swim late, and use the $2.50 bus.
Take this page with you
This page, the offline map and every Orbus bus time on your phone.
 On a laptop?
Scan with your phone.
- Mean, the warmest month
- 15.9 C
- Rain for the month
- 72 mm
- Sunshine, the most of the year
- 237 h
- Occupancy in the peak, or more
- 89%
- Orbus fare with a Bee Card
- $2.50
From this guide’s sources, listed at the foot of the page.
About this guide
The warmest, sunniest and busiest month: mean 15.9 C, 237 sunshine hours, the lake at its best, and every bed taken until the second week.
By Queenstown Pocket · Corrected 10 September 2026 · Photograph: Queenstown Bay from the Gardens side, January 2008 (all photo credits)
The weather, by the numbers
Queenstown in January
SummerMean temperature, C
Rainfall, mm
Sunshine, hours
15.3 h
of daylight, 15 January
| Month | Mean temperature | Rain | Sunshine |
|---|---|---|---|
| December | Mean temperature: 14.3 C | Rain: 60 mm | Sunshine: 213 h |
| January | Mean temperature: 15.9 C | Rain: 72 mm | Sunshine: 237 h |
| February | Mean temperature: 15.6 C | Rain: 51 mm | Sunshine: 209 h |
Thirty-year normals, not a forecast: rain in every month here arrives as fronts that pass in hours. The month-by-month guide has the whole year side by side.
Now in Queenstown
- Sunset
- Daylight
Sun times computed for the town centre on a level horizon.
Dates that shape the month
| When | What |
|---|---|
| 1 to about 10 January | Tail of the Christmas peak: town full, restaurants booked, the lakefront busy until late |
| Late January | Crowds ease as Australian and New Zealand schools go back; the sweet spot for summer weather with fewer people |
| All month | Great Walks season (Routeburn, Milford) at its busiest; summit tracks clear of snow; ski fields closed |
What to do in January
- Lake and river. Frankton Beach, Sunshine Bay and the Gardens for swimming; the Frankton Track and Kelvin Heights sections of the Queenstown Trail for the flat evening ride.
- Summits early. Ben Lomond and Queenstown Hill before the heat; carry more water than the distance suggests.
- Book the big day. Milford Sound coaches and the Glenorchy tours sell out in the peak; the Milford guide compares coach, fly and drive.
- Leave the car. Every Orbus route is $2.50 with a Bee Card and council parking is free only after 6pm.
Every Orbus route is $2.50 with a Bee Card, including the airport bus; the bus guide has the routes and the events calendar what is on.
Questions people ask
What is the weather like in Queenstown in January?
The warmest and sunniest month: a mean of 15.9 C, 72 mm of rain and 237 sunshine hours on NIWA's 1991 to 2020 normals. Afternoons in the high twenties are common, evenings are light past 9pm, and a southerly can still drop the temperature by ten degrees in an hour.
Is January a good time to visit Queenstown?
For weather, yes; for crowds and prices, it is the hardest month. The first ten days carry the Christmas peak (commercial accommodation at 89 percent or more), and the second half of the month is noticeably easier as schools go back.
Can you swim in Lake Wakatipu in January?
Yes, and January is the month to do it: Frankton Beach, Sunshine Bay and the Gardens foreshore are the usual spots. The lake is glacier-fed and stays cold, so swims are short.
Is anything closed in Queenstown in January?
The ski fields, which close in October and reopen in June. Everything else is open, and the Great Walks, Glenorchy track buses and Milford Road are all in full season.
What’s on in Queenstown in January
- McGazza Fest: Late January. Destination Queenstown's summer guide lists 29 to 31 January 2027; the organiser site still shows the 2026 programme (23 to 25 January 2026)., Skyline Queenstown and Ben Lomond trails, Gorge Road Jump Park and Wynyard Bike Park
- Rise and Shine Summer Mountain Run: Early January. In 2026 the Cardrona race was Saturday 3 January and Treble Cone was Sunday 18 January., Cardrona Alpine Resort (and Treble Cone)
- Queenstown Market: Friday market: Friday, 1 January 2027, Earnslaw Park, lakefront
- Glenorchy Races: Saturday, 2 January 2027, Glenorchy
- Kinisi Rise and Shine Summer Run: Saturday, 9 January 2027, Cardrona Alpine Resort base area
- Lake Hayes A&P Show: Saturday, 9 January 2027, Lake Hayes Showgrounds
- Queenstown Market: Friday market: Friday, 15 January 2027, Earnslaw Park, lakefront
- NAPA 71st New Zealand Grand Prix: Fri, 29 Jan to Sun, 31 Jan 2027, Highlands Motorsport Park, corner SH6 and Sandflat Road, Cromwell
- Queenstown Market: Friday market: Friday, 29 January 2027, Earnslaw Park, lakefront
- Wānaka Summer Concert: Saturday, 30 January 2027, Three Parks Outdoor Arena, Sir Tim Wallis Drive, Wānaka
Get the app
Queenstown Pocket carries the forecast, the buses, the tracks and what is open today, offline, whatever month you arrive.
Related guides
 Planning
Free things to do in Queenstown
Twelve free things, and the $2.50 bus that gets you to each one.Checked 5 Nov 2026 Planning
Queenstown to Milford Sound: coach, fly, or drive
Coach, fly or drive: what each costs, how long it takes, and the Milford Road rules.Checked 6 Nov 2026 Seasons
Best time to visit Queenstown: the weather, month by month
NIWA's monthly temperature, rain and sunshine figures, and what each season is actually like.Checked 12 Oct 2026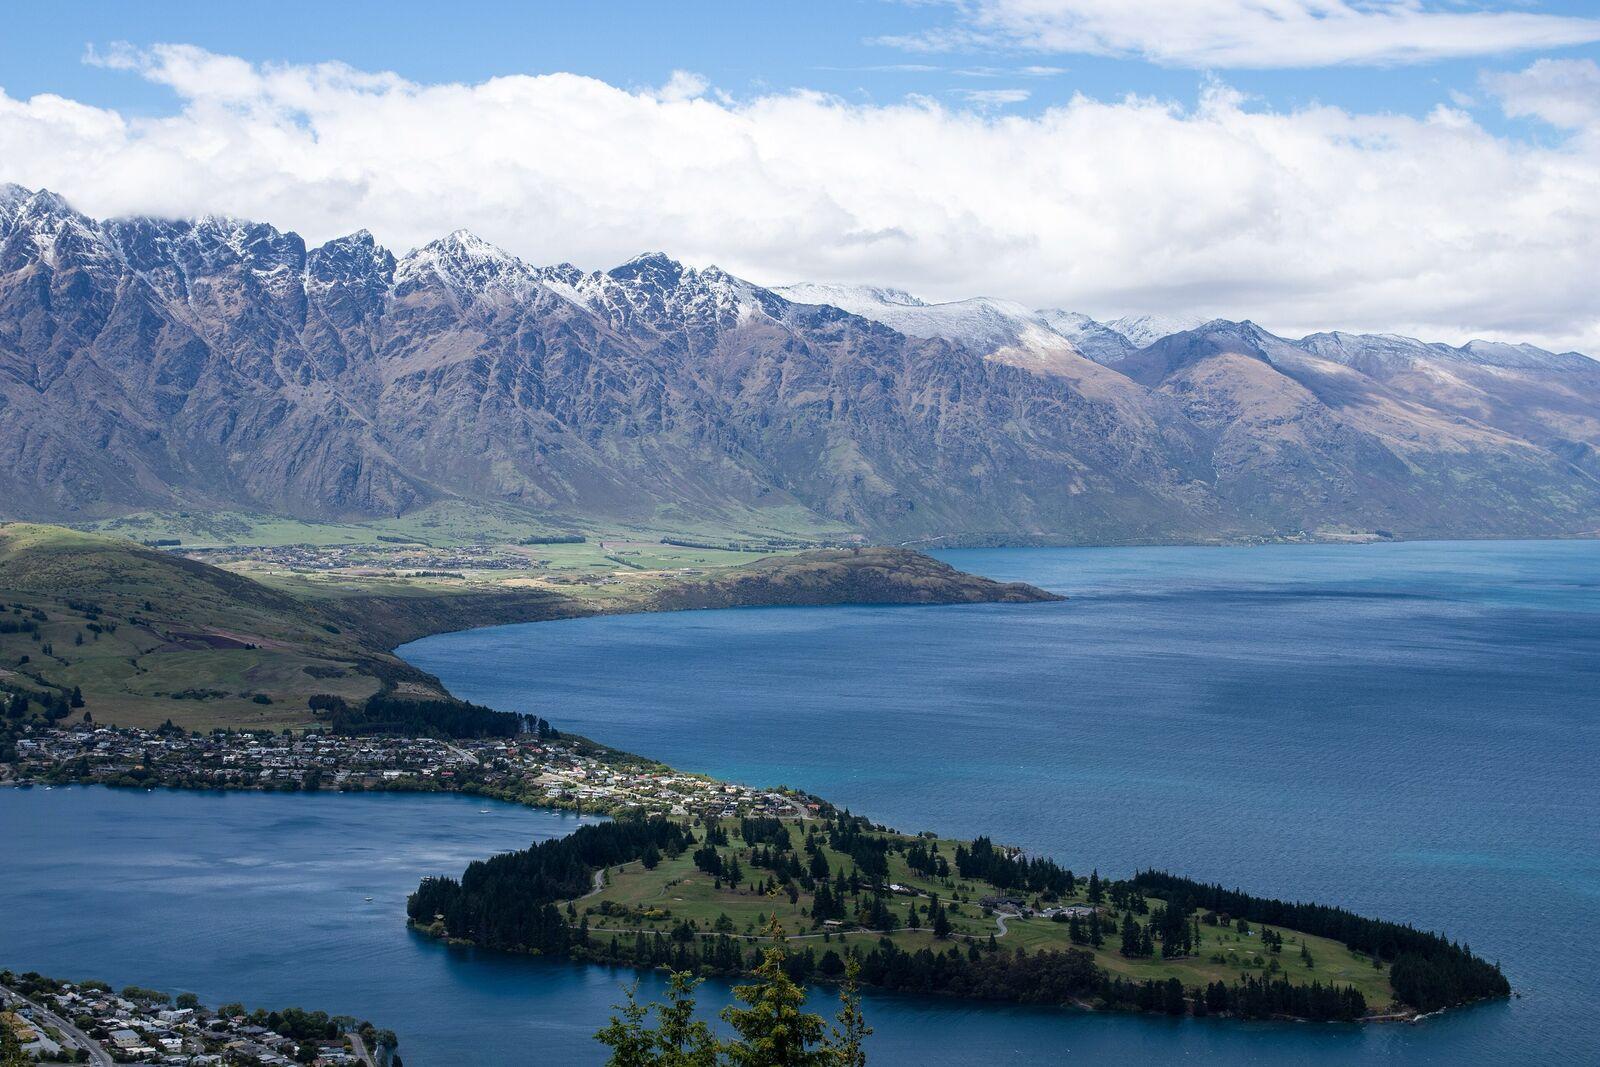 Seasons
Queenstown in December 2026
Summer arrives, the town fills from the 20th and the fireworks close the year: the numbers and the dates.Checked 7 Nov 2026 Seasons
Queenstown's four seasons: the numbers, what is open, what to pack
Highs and lows for every month grouped by season, what opens and closes, and what belongs in the bag.Checked 4 Nov 2026
Photographs are credited on each guide and on the photo credits page.
Sources: NIWA, mean monthly temperatures 1991 to 2020 (opens in a new tab), NIWA, mean monthly rainfall 1991 to 2020 (opens in a new tab), NIWA, mean monthly sunshine hours 1991 to 2020 (opens in a new tab) and Destination Queenstown, Monthly Data Snapshot (commercial accommodation occupancy), retrieved 3 September 2026. Climate figures are NIWA's 30-year normals; season and event dates are the operators' published 2026 dates and shift with the snow and the calendar. This independent guide is published by Tally Sphere Limited, a New Zealand company. Spotted a change? Report a problem with this page and the page address comes with your email.